The First Plant Sensor
A bioelectric sensor on a breadboard — measure the electrical signals of a living plant. The foundation for every further plant activity.
In a nutshell
What: Without any soldering, you build a sensor that makes the tiny electrical signals of a plant visible — live on a small display. At the end you touch a leaf, switch off the light or move close to the plant, and watch the trace respond. This activity is the foundation for 11.2 to 11.4 and 13.1.
Everything is on this page: nothing to print. Components, schematic, build, software, troubleshooting and the complete Arduino sketch are all here.
What it's about
In Chapter 11 you read that plants carry electrical signals — much like your heart or your nerves, only far slower and far weaker. In this activity you build exactly the device that makes those signals visible. At heart it is the same technology behind the Biolingo/GreenMind platform and the Phänomena exhibition "Silent Signals" — only small, cheap and self-built.
At the end you touch a leaf, switch off the light or move close to the plant — and watch how the trace on the display responds. Whether that is already "perception" or merely physics is exactly the question this book turns on. Measure first, marvel second, and stay sceptical.
Safety first — please read before you start
The sensor runs only on USB at 3.3–5 volts — that is harmless. Even so:
- Always unplug the USB cable before you move any wires. Then nothing can short.
- Never force components into the breadboard, and don't bend the legs of the ESP32.
- Avoid touching the metal pins — the charge on your hand (static) can disturb sensitive chips. "Discharge" briefly on a radiator first.
- The gel pads go on a plant leaf, not on your skin. The sensor is not a medical device.
- Work on a dry surface, well away from water and the watering can.
What you need
All the parts come as a ready-made kit or singly from an electronics supplier. Prices are rough guides.
| Component | Qty | What it's for | ≈ price |
|---|---|---|---|
| ESP32 DevKit V1 (WROOM-32, 30 pins) | 1 | The "brain": measures, computes, displays; supplies 3.3 V | €6–9 |
| AD8232 ECG module (red board) | 1 | Amplifies the tiny plant signal | €4–7 |
| OLED display SSD1306, 0.96″, 128×64, I²C | 1 | Shows the signal trace live | €3–5 |
| Breadboard (830 contacts) | 1 | Plugs everything together without soldering | €3–5 |
| Resistor 10 kΩ (¼ W) | 1 | Part of the low-pass filter | < €0.10 |
| Capacitor 1 µF (ceramic) | 1 | Part of the low-pass filter | < €0.20 |
| Jumper wires, male–male | 7 | Connect the components | ~€2 |
| ECG electrode cable + gel pads | 1 | Makes contact with the leaf | ~€3 |
| Micro-USB cable (with data line!) | 1 | Power and programming | on hand |
Plus: a laptop with the free Arduino IDE and a sturdy houseplant. Best of all is a Kalanchoe (thick, waxy leaves) — more on that below.
A little background
What is a bioelectric signal? Every living cell holds a small electrical voltage across its membrane. When something changes in a plant — it is touched, the light shifts, it loses water — voltage waves run through the tissue, much like nerve impulses in us. Those are exactly the waves you pick up.
Why is it so hard? Two reasons. First, the signal is tiny — we are talking millionths of a volt (microvolts). Hence the amplifier (AD8232). Second, it is very slow: plant signals oscillate at only about 0.1 to 10 Hz, so at most a few times a second.
Why do we need a filter? Every socket and every wire in the wall radiates the mains supply at 50 Hz. This "mains hum" is far stronger than the plant signal and would drown it out. A simple RC low-pass — one resistor and one capacitor — lets the slow plant signals through and damps everything faster. Its cut-off frequency works out like this:
Everything below 16 Hz (your plant signal) gets through, the 50 Hz hum is damped. Remember the formula — it is the whole trick.
How the breadboard works
If you have never used a breadboard, this is the most important part — otherwise you push components into holes that aren't connected at all.
The three rules of the breadboard
- A trench (the centre channel) runs down the middle. It separates the top half from the bottom half.
- The short rows of five run at right angles to the trench: the five holes a–e of a column are joined to each other, and likewise f–j. Across the trench they are NOT joined.
- Along the edges run two long rails marked + and − (red/blue). They stretch the whole length and serve as the power rails (3.3 V and GND).
So a component "connects" two points by having both legs pushed into the same column of five — or you run a jumper from one column to the next.
Identifying the components
The 10 kΩ resistor carries four colour rings: brown–black–orange–gold. Resistors have no polarity, so you can plug them in either way round.
The 1 µF ceramic capacitor is a small disc, usually marked "105". Important: take the ceramic type — it has no polarity. (An electrolytic capacitor would have a long plus leg and a short minus leg.)
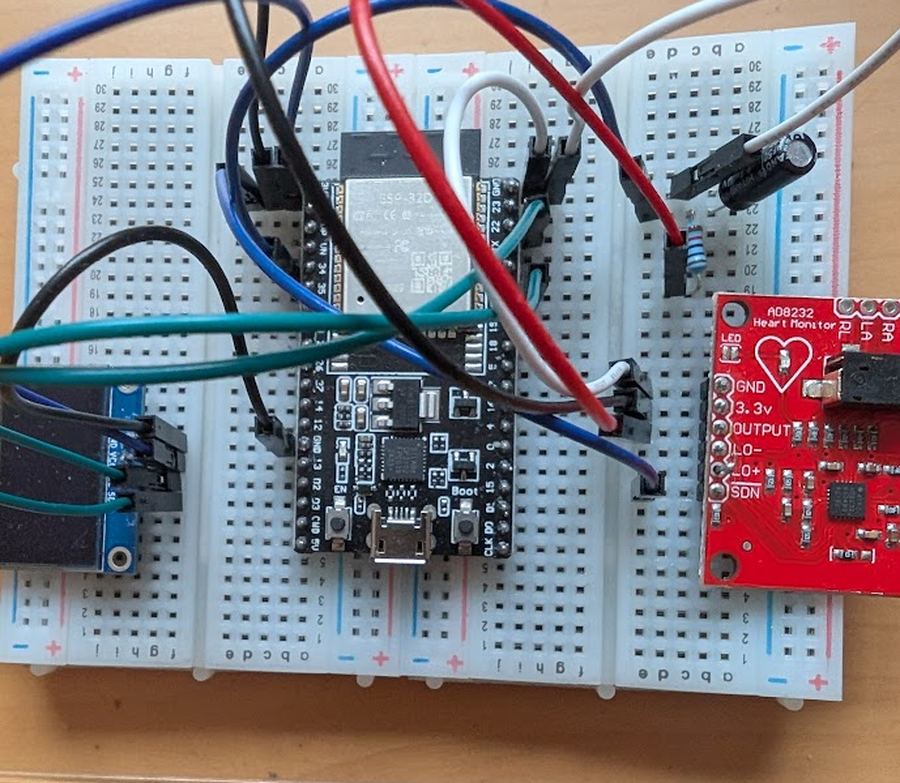
The three modules you tell apart like this: the ESP32 is the long board with the silver metal lid and the USB socket. The AD8232 is the small red board with a printed heart and the labels GND, 3.3V, OUTPUT. The OLED is the small glass display with four pins: VCC, GND, SCL, SDA.
The schematic in words
Before you plug anything in, fix the path of the signal in your mind:
- Power: the ESP32 gets power over USB and puts out 3.3 volts at its 3V3 pin. From there you feed both the AD8232 and the OLED. There is no second power source.
- Signal path: leaf → gel electrode → AD8232 (amplifies) → OUTPUT → 10 kΩ resistor → node → GPIO34 (which measures). At the node the 1 µF capacitor also hangs to GND — that is the filter.
- Display: the OLED talks to the ESP32 over I²C — two data lines: SCL to GPIO22, SDA to GPIO21.
Step by step
Do NOT plug in the USB cable yet. First build, then check, then power.
- Seat the ESP32. Set the ESP32 in the middle so that it bridges the trench — one row of pins in the top half, the other in the bottom. Only then does each pin get its own column of five. (If it sits entirely on one side, its pins are shorted — the most common beginner mistake.)
- Lay the power rails. With two short jumpers, run the ESP32's 3V3 pin to the red (+) rail and a GND pin to the blue (−) rail. From these rails you power both modules in a moment.
- Build the RC filter. Push one leg of the 10 kΩ resistor into a free column (this becomes the node). From the node, run the 1 µF capacitor to the GND rail. The node is the heart of the filter.
- Connect the AD8232. AD8232 3.3V to the (+) rail, GND to the (−) rail, OUTPUT with a jumper to the free leg of the resistor (i.e. into the signal path before the node).
- Filter to the measuring input. Connect the node (resistor output / capacitor) to GPIO34 of the ESP32. This is the pin where the ESP32 measures the voltage.
- Connect the OLED. VCC to (+), GND to (−). Then the two data lines: SCL to GPIO22, SDA to GPIO21. Wiring complete.
- Plug in USB. Check everything once more against the table below, then plug in the micro-USB cable. The ESP32 lights up and powers everything.
Wiring at a glance
| No. | from | to | colour | what for |
|---|---|---|---|---|
| 1 | AD8232 3.3V | (+) rail / ESP32 3V3 | red | Power for the sensor |
| 2 | AD8232 GND | (−) rail / ESP32 GND | black | Ground of the sensor |
| 3 | AD8232 OUTPUT | 10 kΩ resistor (input) | green | Raw signal into the filter |
| 4 | Resistor (output) / capacitor | ESP32 GPIO34 | green | Filtered signal → measuring input |
| 5 | Capacitor 1 µF | (−) rail / GND | — | Filter to ground |
| 6 | OLED VCC | (+) rail / ESP32 3V3 | red | Power for the display |
| 7 | OLED GND | (−) rail / ESP32 GND | black | Ground of the display |
| 8 | OLED SCL | ESP32 GPIO22 | violet | I²C clock |
| 9 | OLED SDA | ESP32 GPIO21 | violet | I²C data |
That's 7 jumpers plus the resistor, capacitor and electrode cable — no more.
The software: setting up the Arduino IDE
So the ESP32 knows what to do, you flash it a small program (the "sketch"). You do that with the free Arduino IDE.
- Install the Arduino IDE. Download it from arduino.cc and install it.
- Add ESP32 support. Open File ▸ Preferences and enter under
"Additional boards manager URLs":
https://raw.githubusercontent.com/espressif/arduino-esp32/gh-pages/package_esp32_index.json - Install the board. Open Tools ▸ Board ▸ Boards Manager, search for "esp32" and install the package from Espressif.
- Select the board. Under Tools ▸ Board choose "DOIT ESP32 DEVKIT V1".
- Install the libraries. Open Tools ▸ Manage Libraries and install "Adafruit SSD1306" and "Adafruit GFX Library".
- Choose the port. Plug in the ESP32 and under Tools ▸ Port select the newly appeared COM/USB port. (If none appears, the USB driver CP210x or CH340 may be missing — install it quickly.)
- Upload. Open the sketch (below on this page, or on GitHub) and click "Upload". If it stalls at the start, hold the BOOT button on the ESP32 until the upload begins.
Tip: see the trace on the laptop too
After uploading, open Tools ▸ Serial Plotter (115200 baud). There the same trace runs large across the screen — handy for watching the deflections closely.
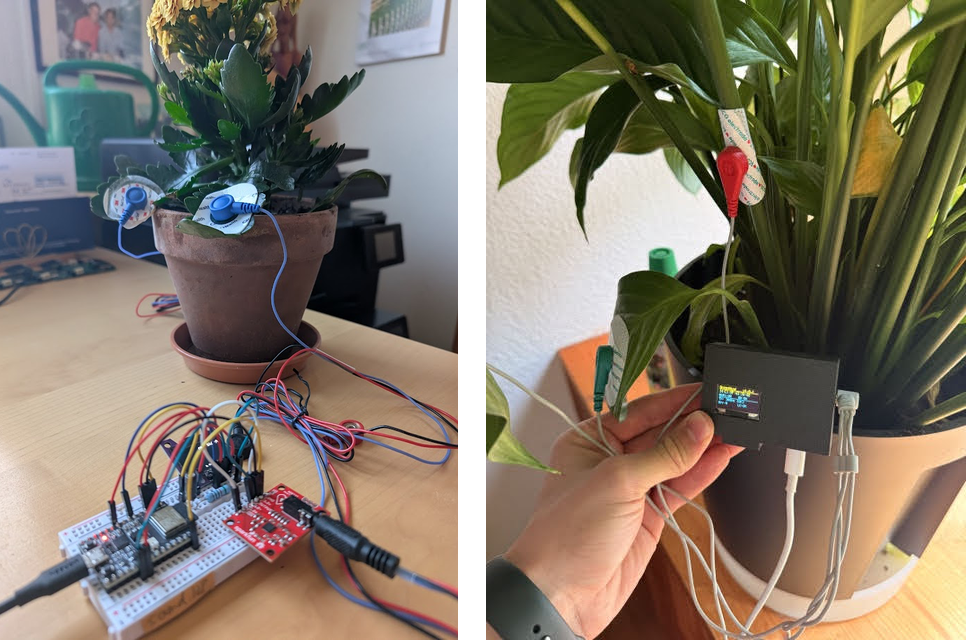
The electrode on the leaf
Now comes the finest moment: the connection to the plant. You need only a single gel electrode on a single leaf.
Which plant?
- Kalanchoe (recommended): thick, waxy leaves hold the electrode well — the most forgiving for a first go.
- Primrose: softer, thin-skinned leaves, often a lovely signal; press the electrode on gently.
- Tradescantia: smooth, juicy leaves, good conductivity.
Tips for good contact
- Wipe the leaf gently beforehand with a damp cloth.
- Press the gel pad down firmly for 5 seconds when sticking it on — the first grip is decisive.
- Avoid the leaf edge and the midrib; stick to the smooth area between the veins.
- Plug the electrode cable into the 3.5 mm socket of the AD8232.
What you should see
A line runs across the OLED from right to left — your plant signal in real time. At first it often drifts slowly up and down while the contact "settles" (a minute or two). A completely flat or wildly jittering line points to a contact or wiring problem — see below.
Now experiment
Once the trace is running, try out what the plant responds to:
- Touch a leaf gently — watch whether the trace briefly deflects.
- Switch the room light off and on again — plants register changes in light.
- Hold your hand or your face close to the plant, calmly, then agitated. Does anything change? (This is the big open question of the book.)
- Play music nearby and look for coherent patterns.
- Compare the same tests on Kalanchoe, primrose and Tradescantia.
When it sticks
| Problem | Likely cause & fix |
|---|---|
| Display stays black | Usually the I²C address is wrong: most SSD1306 use 0x3C, some 0x3D. Change the address in the sketch or run an I²C scanner. Also check for swapped SCL/SDA. |
| Line is flat | Poor electrode contact: clean the leaf, press the pad on again. Check that the capacitor really sits on the GND rail and isn't left "hanging in the air". |
| Line jitters wildly / 50 Hz hum | Filter ineffective: is the resistor in the signal path and the capacitor to GND? Don't touch the bare pins during the measurement. |
| ESP32 pins short out | The ESP32 isn't sitting over the centre channel. Both rows of pins must be in different halves. |
| No port in the IDE | The USB cable may be charge-only with no data line — try another cable. Otherwise install the USB driver (CP210x/CH340). |
| Upload aborts | At "Connecting…", hold the BOOT button on the ESP32 until the upload starts. |
Food for thought
Before you turn a deflection into "the plant felt me", think like a researcher:
- How do you know the trace is responding to the plant and not to your movement, your static charge or a loose contact? How could you rule that out?
- What would be a good control? (Hint: the same measurement on a cut-off leaf, or with the electrode in the air.)
- If several groups measure the same thing — do you get the same result? Only then does a coincidence become a finding.
Exactly this interplay of wonder and scepticism is the thread running through the whole book. You now have the tool to check for yourself.
Appendix: the Arduino sketch
This code reads the value at GPIO34, draws the trace onto the OLED and sends the values to the Serial Plotter. The tested version is also on GitHub.
/*
  Plant sensor - Hidden Signals, Activity 1
  ----------------------------------------------------------------
  Reads the bioelectric signal of a living plant via the AD8232
  module, shows the trace live on the OLED display and also sends
  the values to the Serial Plotter of the Arduino IDE.

  Board: DOIT ESP32 DEVKIT V1
  Libraries: Adafruit SSD1306 + Adafruit GFX
  Wiring: signal to GPIO34, OLED to SDA=GPIO21 / SCL=GPIO22
*/
#include <Wire.h>
#include <Adafruit_GFX.h>
#include <Adafruit_SSD1306.h>

const int WIDTH  = 128;          // OLED width in pixels
const int HEIGHT = 64;           // OLED height in pixels
const int OLED_ADDRESS = 0x3C;   // usually 0x3C, rarely 0x3D
const int SIGNAL_PIN = 34;       // GPIO34 = analogue input (ADC)

Adafruit_SSD1306 display(WIDTH, HEIGHT, &Wire, -1);
int curve[WIDTH];                // buffer for the displayed trace

void setup() {
  Serial.begin(115200);
  Wire.begin(21, 22);            // SDA = GPIO21, SCL = GPIO22
  if (!display.begin(SSD1306_SWITCHCAPVCC, OLED_ADDRESS)) {
    Serial.println("OLED not found - check the address (0x3C or 0x3D)!");
    while (true) { delay(100); }  // stay here until the display works
  }
  analogReadResolution(12);      // values from 0 to 4095
  for (int i = 0; i < WIDTH; i++) curve[i] = HEIGHT / 2;
  display.clearDisplay();
  display.display();
}

void loop() {
  int value = analogRead(SIGNAL_PIN);  // read 0 .. 4095
  Serial.println(value);               // for the Serial Plotter

  // shift the trace one pixel left and append the new value
  for (int i = 0; i < WIDTH - 1; i++) curve[i] = curve[i + 1];
  curve[WIDTH - 1] = map(value, 0, 4095, HEIGHT - 1, 0);

  // redraw the display
  display.clearDisplay();
  display.setTextSize(1);
  display.setTextColor(SSD1306_WHITE);
  display.setCursor(0, 0);
  display.print("Plant signal");
  for (int i = 0; i < WIDTH - 1; i++)
    display.drawLine(i, curve[i], i + 1, curve[i + 1], SSD1306_WHITE);
  display.display();
  delay(20);                     // about 50 measurements per second
}
And then?
Once the trace runs quietly, it continues: in 11.2 Touch and Light you give the plant deliberate stimuli and learn to tell a real response from a loose contact. The sensor you built here carries you through all four plant activities and the 24-hour recording in 13.1.